
First of all, why do we do this in an agency?
In a digital marketing agency, data comes from too many different places: Google Ads, Meta, Analytics, Search Console, CRMs, programmatic platforms… Each one has its own interface, its own update frequency, and its own way of naming things. The problem isn’t that the data doesn’t exist — it’s that we have to check it separately.
When a client asks how much they’ve invested in total and what results they’ve generated, answering that means opening multiple tabs, exporting several files, doing manual calculations (with a risk of errors), and spending a significant amount of time.
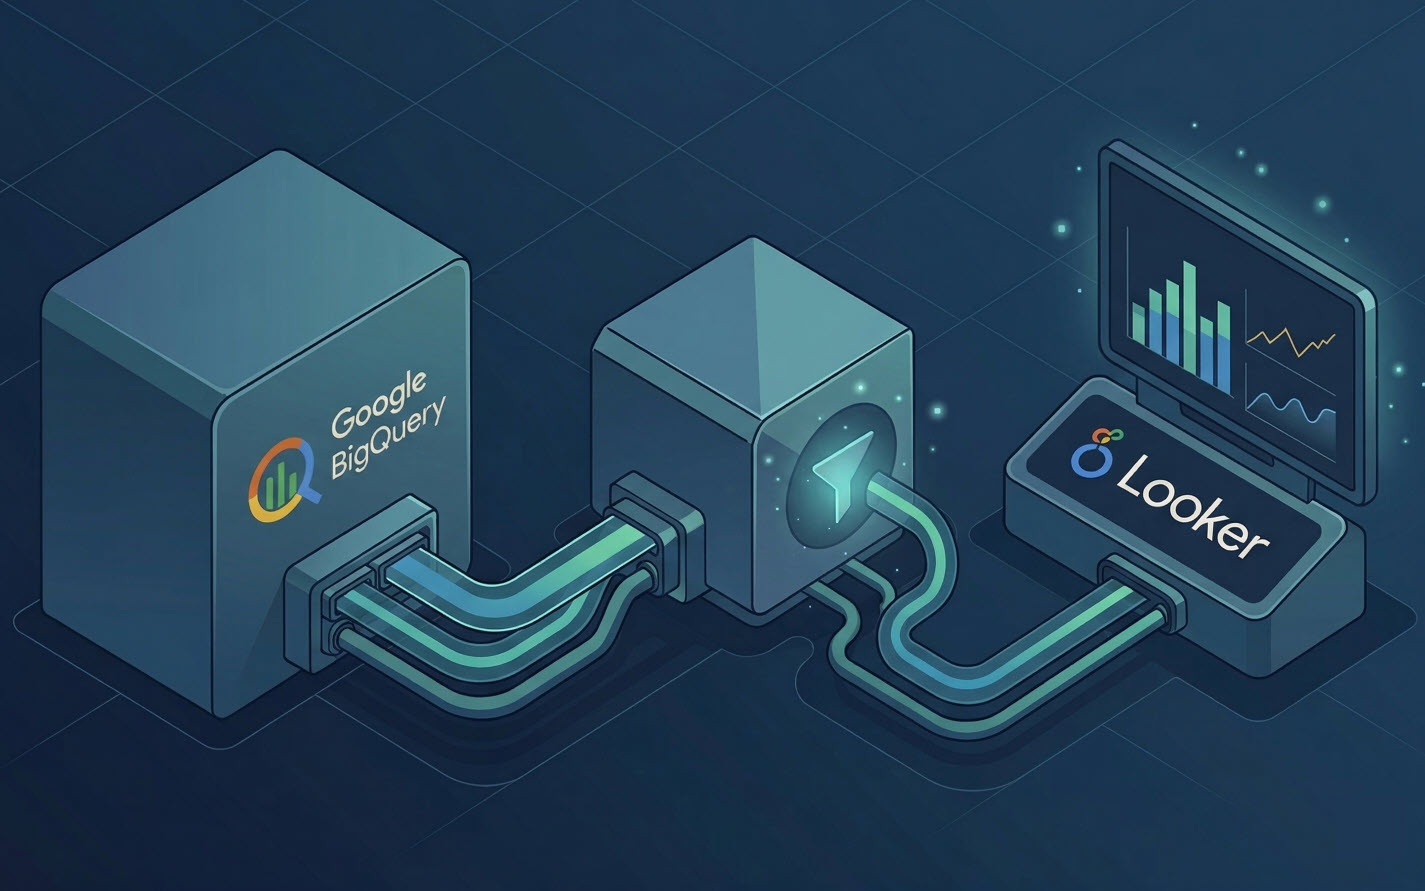
BigQuery solves this. It’s a Google Cloud database that allows you to import data from different sources and store it in a structured way. From there, you can connect Looker Studio directly to BigQuery and display that data in visual reports, without needing to touch anything else.
The goal isn’t to have more data. It’s to have the right data in one place, reliably accessible, so we can answer business questions without relying on manual exports.
What are the benefits?
Cleaner, more flexible visualization
When we connect Looker Studio to BigQuery, reports no longer depend on separate connectors with their own limitations. We can create charts, tables, and calculated metrics using data that’s already clean and structured in the database. The result is a more accurate report that’s easier to maintain.
Loading speed
BigQuery is designed to process large volumes of data quickly. Queries over millions of rows run in seconds. In practice, this means that a Looker Studio report that used to load slowly — because it relied on a direct connector to Google Ads, a large spreadsheet, or a mix of sources — will now load almost instantly with BigQuery.
Data reliability
Looker Studio’s native connectors rely on APIs that have quotas, version changes, and occasional outages. If a connector fails, the report shows errors or blank data. With BigQuery, the data is already stored: even if the original source has a temporary issue, the report keeps working with the data that was already imported.
On top of that, by centralizing everything in BigQuery, we can standardize campaign names, KPIs, remove duplicates, fix attribution issues, or adjust metrics before they even appear in the report.
Historical data retention beyond platform limits
Some platforms limit how much historical data you can access. Google Ads allows you to query up to 36 months of data. Meta has similar restrictions. Search Console only keeps 16 months of search performance data.
By importing this data into BigQuery on a regular basis, we ensure that the full history is stored in a database — even if the original platform no longer shows it. This allows for year-over-year analysis and long-term trend detection that would otherwise be impossible.
How it’s done
Step 1: Import data into BigQuery
The first step is to bring data from the original sources into BigQuery. There are several ways to do this:
- Google native connectors: Google Ads, Analytics 4, Search Console, and YouTube have direct integration with BigQuery through the BigQuery Data Transfer Service.
- Third-party connectors: Tools like Supermetrics, Fivetran, Airbyte, or Windsor.ai allow you to import data from Meta, TikTok, LinkedIn, email platforms, and other sources without native BigQuery integration.
- Manual uploads or scripts: For very specific sources or client-owned data, you can upload CSV files or set up Python scripts that write directly into BigQuery via the Google Cloud API.
In all cases, the process involves defining a dataset within your BigQuery project (think of it as a folder that groups tables), and then creating the tables where the data will be stored. Each table has a schema: a definition of the columns it contains and the type of data each one holds (date, integer, text, etc.).
A key technical detail: BigQuery works best with columnar data formats. When designing table schemas, it’s important to clearly separate dimensions (campaign, channel, date, country) from metrics (impressions, clicks, conversions, cost). Using date-partitioned tables reduces the amount of data processed per query, which also lowers costs.
Step 2: Transform and structure the data
Once the data is in BigQuery, the next step is to normalize it. Different platforms may name the same user actions differently — what Google Ads calls a “conversion” might be labeled “website conversion” in Meta, for example — and they arrive with different structures.
In BigQuery, you can create a unified table that combines spend from Google Ads and Meta into a single dataset, with consistent column names and structure, ready to be queried from Looker Studio.
Step 3: Connect BigQuery to Looker Studio
Looker Studio has a native connector for BigQuery. When creating a new data source, you simply select BigQuery, choose the project, dataset, and the table or view you want to use, and it’s ready for reporting.
From that point on, any chart or table in the report queries the database directly. If the data in BigQuery is updated (for example, if the Transfer Service pulls in new data overnight), the report automatically reflects those updates the next time it loads.
What this enables (and what Looker Studio alone can’t do)
Looker Studio has a feature called data blending that allows you to combine different sources in a single chart. It works, but it has limitations: it doesn’t support complex joins, it allows a maximum of five sources per blend, it struggles with large datasets, and it doesn’t support advanced business logic.
With BigQuery as a central layer, those combinations are done at the data level before anything reaches the report. Some specific things this enables:
- Comparing campaign performance across Google Ads and Meta in a single chart, using metrics calculated consistently under the same conversion definition.
- Combining paid media performance data with CRM sales data to calculate real ROAS — not the version each platform reports separately.
- Analyzing periods longer than 16 months (Search Console) or 36 months (Google Ads), even though the platforms themselves no longer provide that data.
- Applying custom business rules: excluding brand campaigns from total cost calculations, reassigning conversions based on client-agreed criteria, or creating composite metrics that no platform provides natively.
All of this happens in the data layer, not in the report. The report simply displays the result. That means reports are cleaner, faster to build, and easier to maintain, because the logic lives in one place instead of being scattered across multiple data sources configured directly in Looker Studio.
The cost of maintaining this infrastructure is low. BigQuery uses a pricing model based on storage and queries. For the typical data volume of a mid-sized agency, monthly costs rarely exceed a few euros if the structure is well designed from the start.
The initial setup takes more time than connecting Looker Studio directly to each platform, but it pays off quickly: once the infrastructure is in place, adding a new client or data source is just a matter of replicating the structure, adjusting the necessary KPIs, and fine-tuning the queries.